Dilution Factor

Step 1. Using Carbon histogram as the fitting function of the butanol data

The blue hydrogen line of the left hitograms are made by the fitting mathod. I used carbon histogram in carbon data as the fitting function of the butanol data. so, (Gaussian + Carbon histogram) is the fitting function for butanol data. In this function, the gaussian is for hydrogen function.
The advantage of this method is that we do not need the Scale Factor.

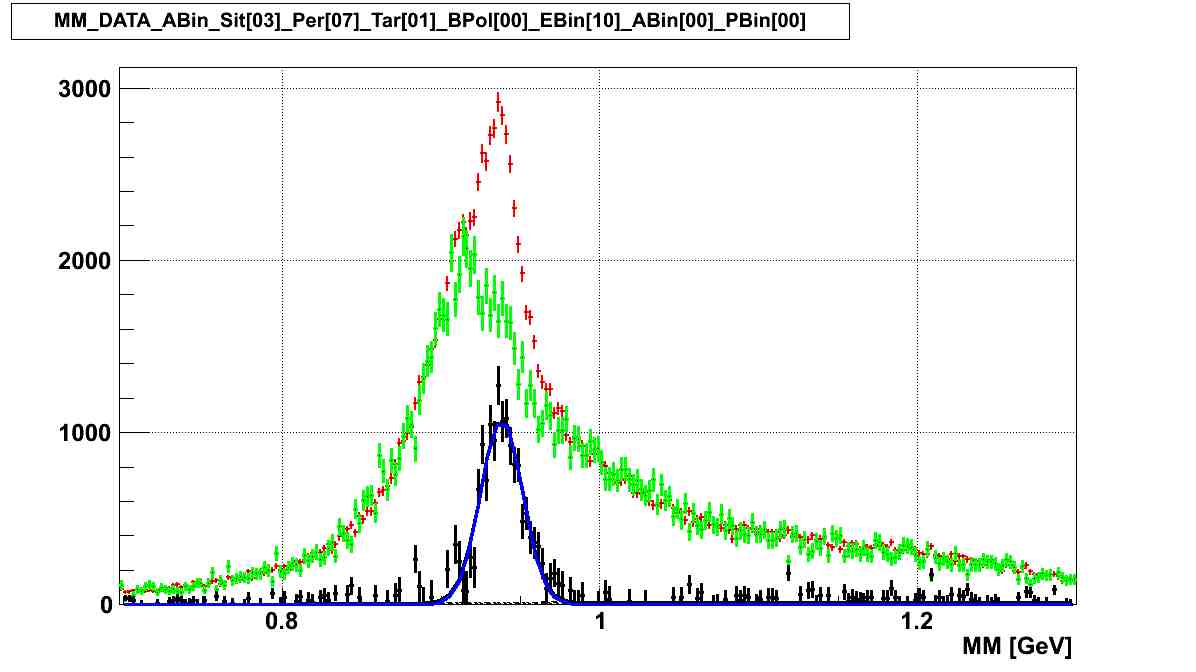
The blue hydrogen line of the right hitograms are made by the subtraction method. That is, I have subtracted the scaled carbon histogram from the butanol histogram.

The red point : Butanol
The black line : Fitting Function ( Gaus + Carbon histogram )
The blue line : Hydrogen (free proton events)
The green line : Bound Nucleon Events
The pink point : Carbon
The red point : Butanol
The green point : Scaled Carbon ( Carbon X Scale_Factor )
The black point : Hydrogen ( Butanol - Carbon X Scale_Factor
The blue line : Hydrogen (free proton events)

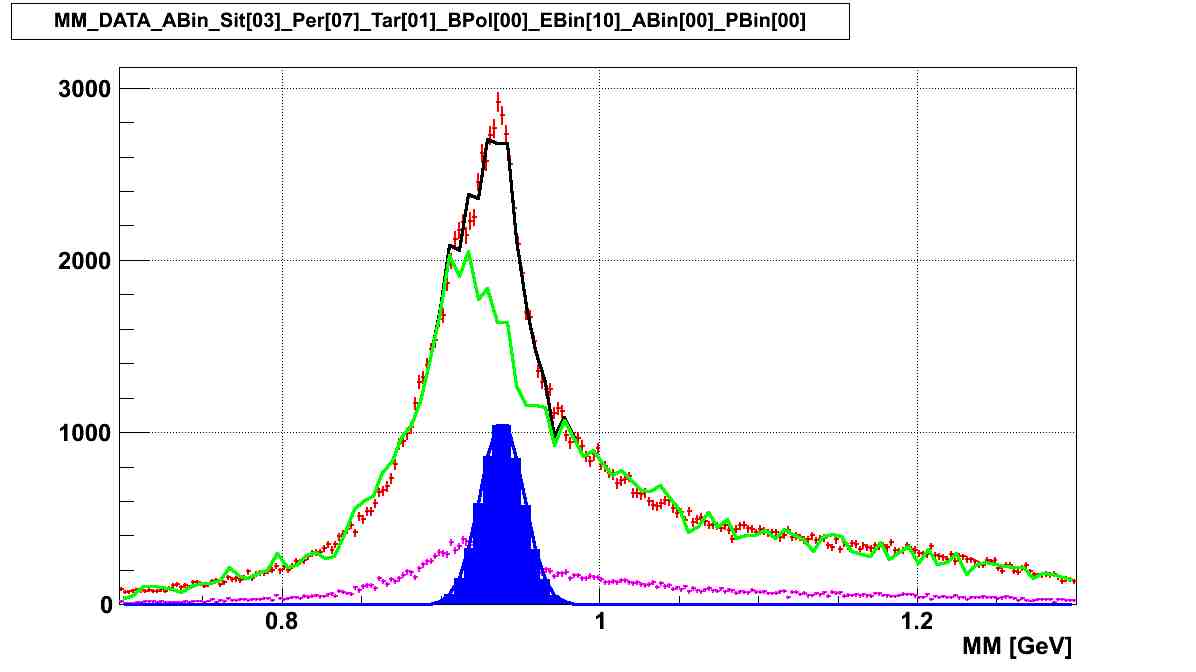
Fitting Function: Gaus + Carbon histogram
(The fitting method)

Hydrogen : Butanol - Carbon X Scale Factor
( The subtraction method)

EBin[04]: 0.6GeV - 0.7GeV
EBin[05]: 0.7GeV - 0.8GeV
EBin[06]: 0.8GeV - 0.9GeV
EBin[07]: 0.9GeV - 1.0GeV
EBin[08]: 1.0GeV - 1.1GeV
EBin[09]: 1.1GeV - 1.2GeV
EBin[10]: 1.2GeV - 1.3GeV
EBin[11]: 1.3GeV - 1.4GeV
EBin[12]: 1.4GeV - 1.5GeV
EBin[13]: 1.5GeV - 1.6GeV
EBin[14]: 1.6GeV - 1.7GeV
EBin[15]: 1.7GeV - 1.8GeV
EBin[16]: 1.8GeV - 1.9GeV
EBin[17]: 1.9GeV - 2.0GeV
EBin[18]: 2.0GeV - 2.1GeV
EBin[19]: 2.1GeV - 2.2GeV
When we can compare the green line between left and right picture, both have very similar shape.
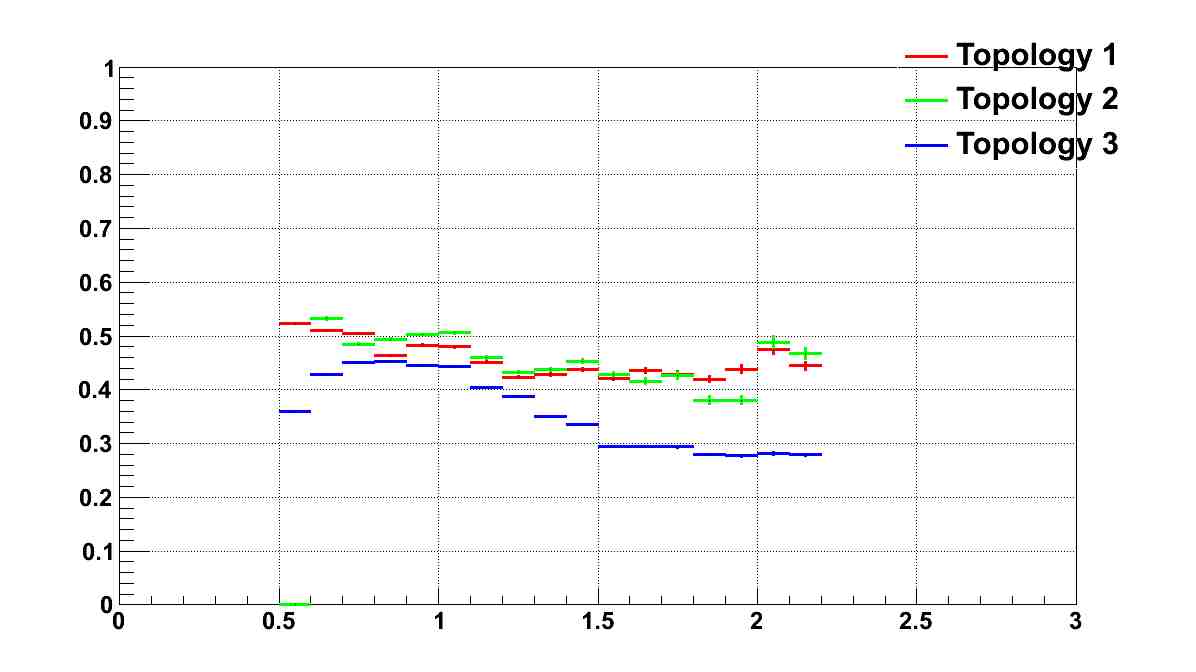
That is, we can know the bound necleon part in the butanol data without Scale Factor.
The following plots are the Dilution Factor made in the fitting method and the subtraction method.

The fitting method

The subtraction method

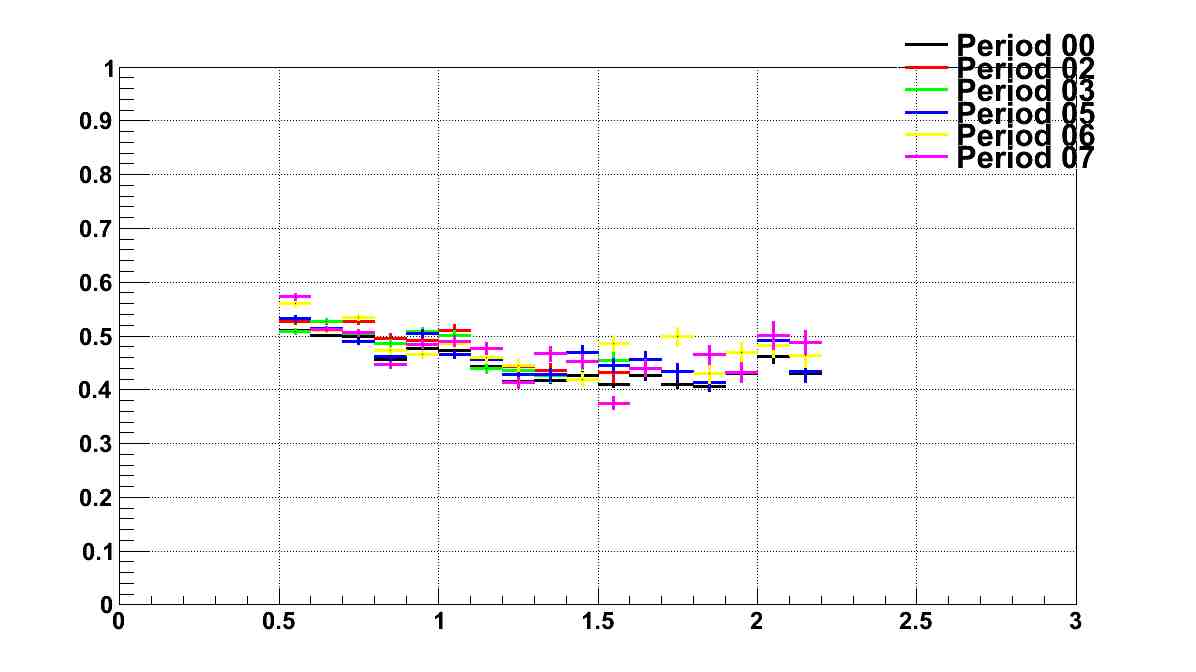
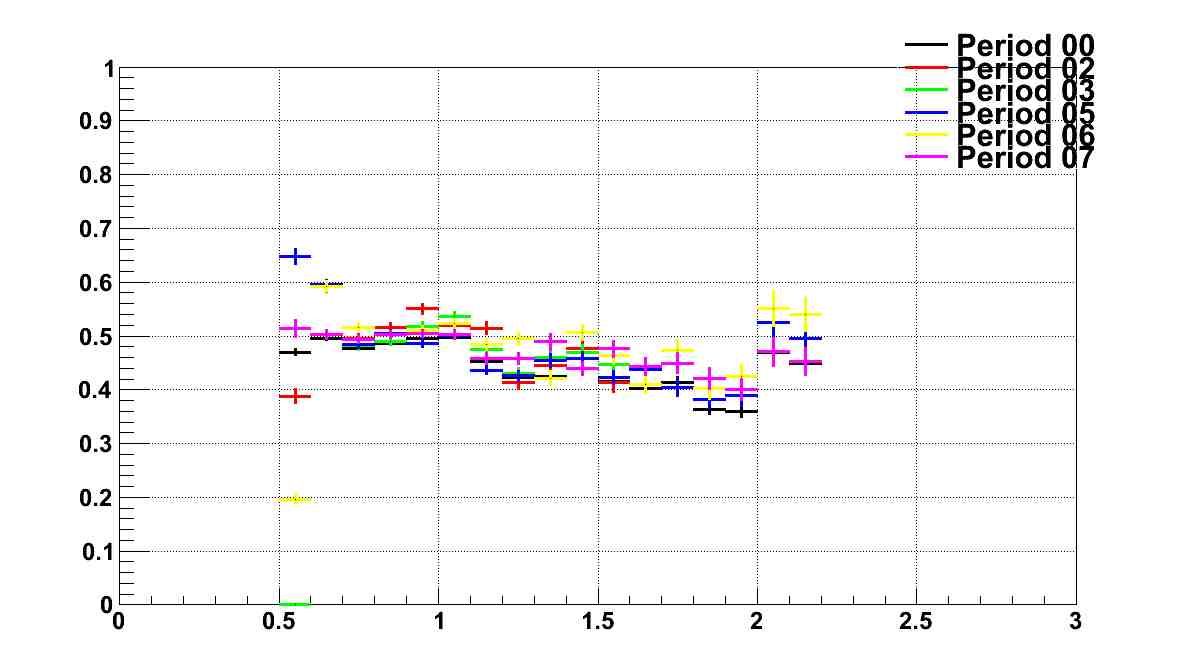
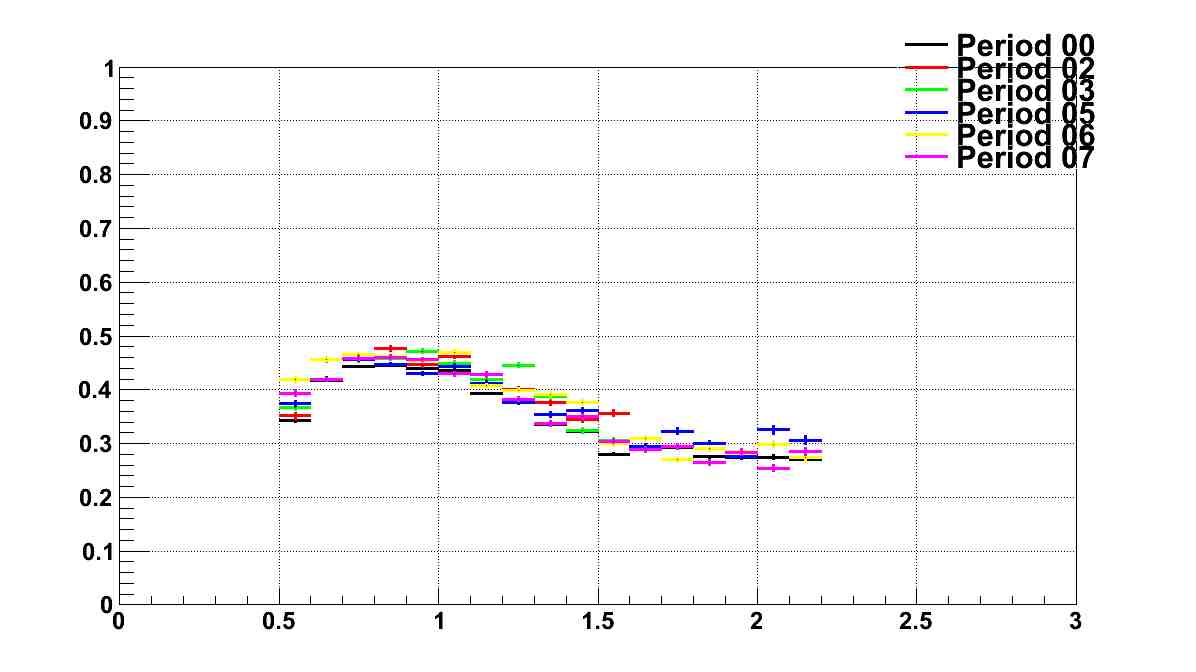
Step 2. Dilution Factor in each topology and each period

Topology : γ p -> p π+ ( π- )

Topology : γ p -> p π- ( π+ )

Topology : γ p -> π+ π- ( p )

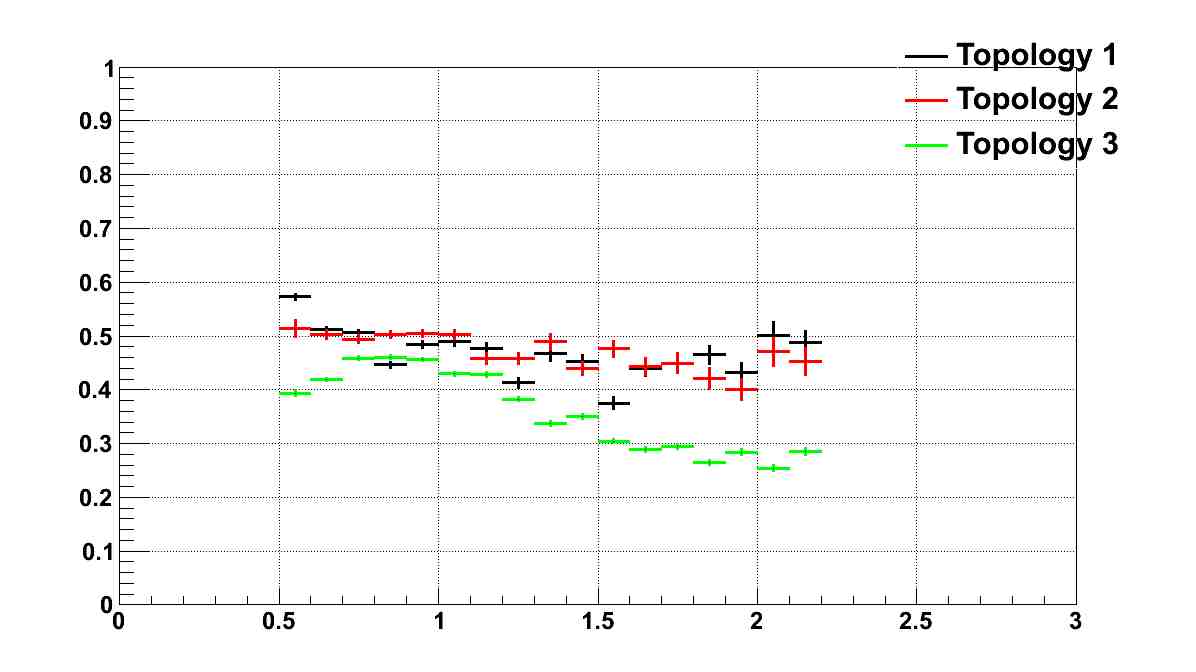
Step 3. The Average Dilution Factor in each topology

Average